Create custom rules
Now we are exporting metrics, these metrics can also be used to generate alerts. To generate alerts, we first need to create a Prometheus Rule:
-
Go to
appsand openGitea. -
In the list of repositories there is a repository called
otomi/team-<team-name>-argocd. Go to this repository. -
Click
Add Fileand thenNew File. -
Name the file
my-custom-rules.yaml. -
Add the following manifest to the file:
apiVersion: monitoring.coreos.com/v1
kind: PrometheusRule
metadata:
  labels:
    prometheus: team-labs # change labs to the name of your team
  name: labs-custom-rules
spec:
  groups:
  - name: custom.rules
    rules:
    - alert: 50GreetingsReached
      annotations:
        description: We reached 50 greetings!
        summary: The number of greetings has reached more than 50.
      expr: application_greetings_total > 50
      for: 1m
      labels:
        severity: warning
- Commit changes in Gitea.
See rules in Prometheus
Now let's check to see if Prometheus has picked-up the rule:
-
Go to
Appsand openPrometheus. -
In the menu click on
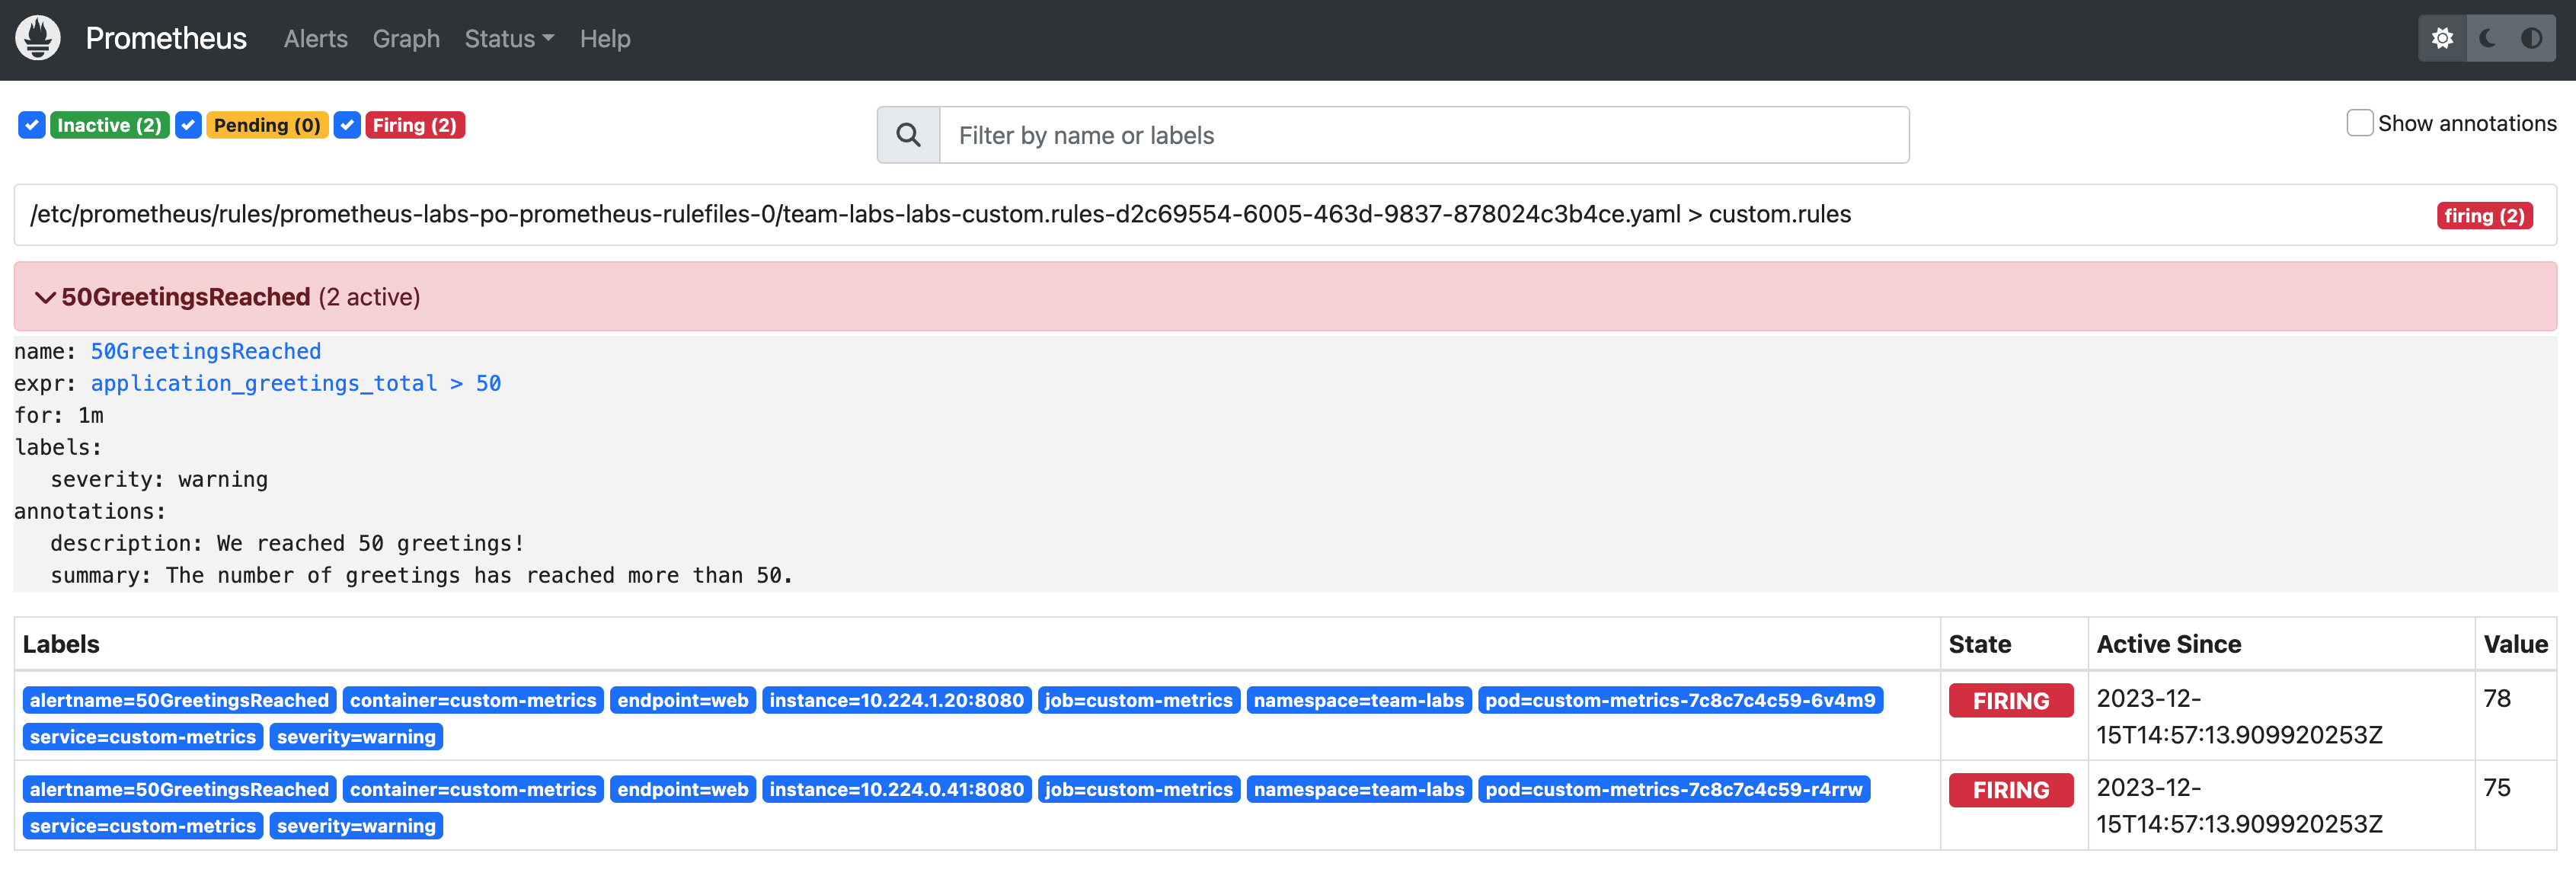
Statusand thenRules. You should now see the rule:

-
In the menu in Prometheus, click
Alerts -
You should see an alert has been fired:

See alerts in Alertmanager
-
Go to
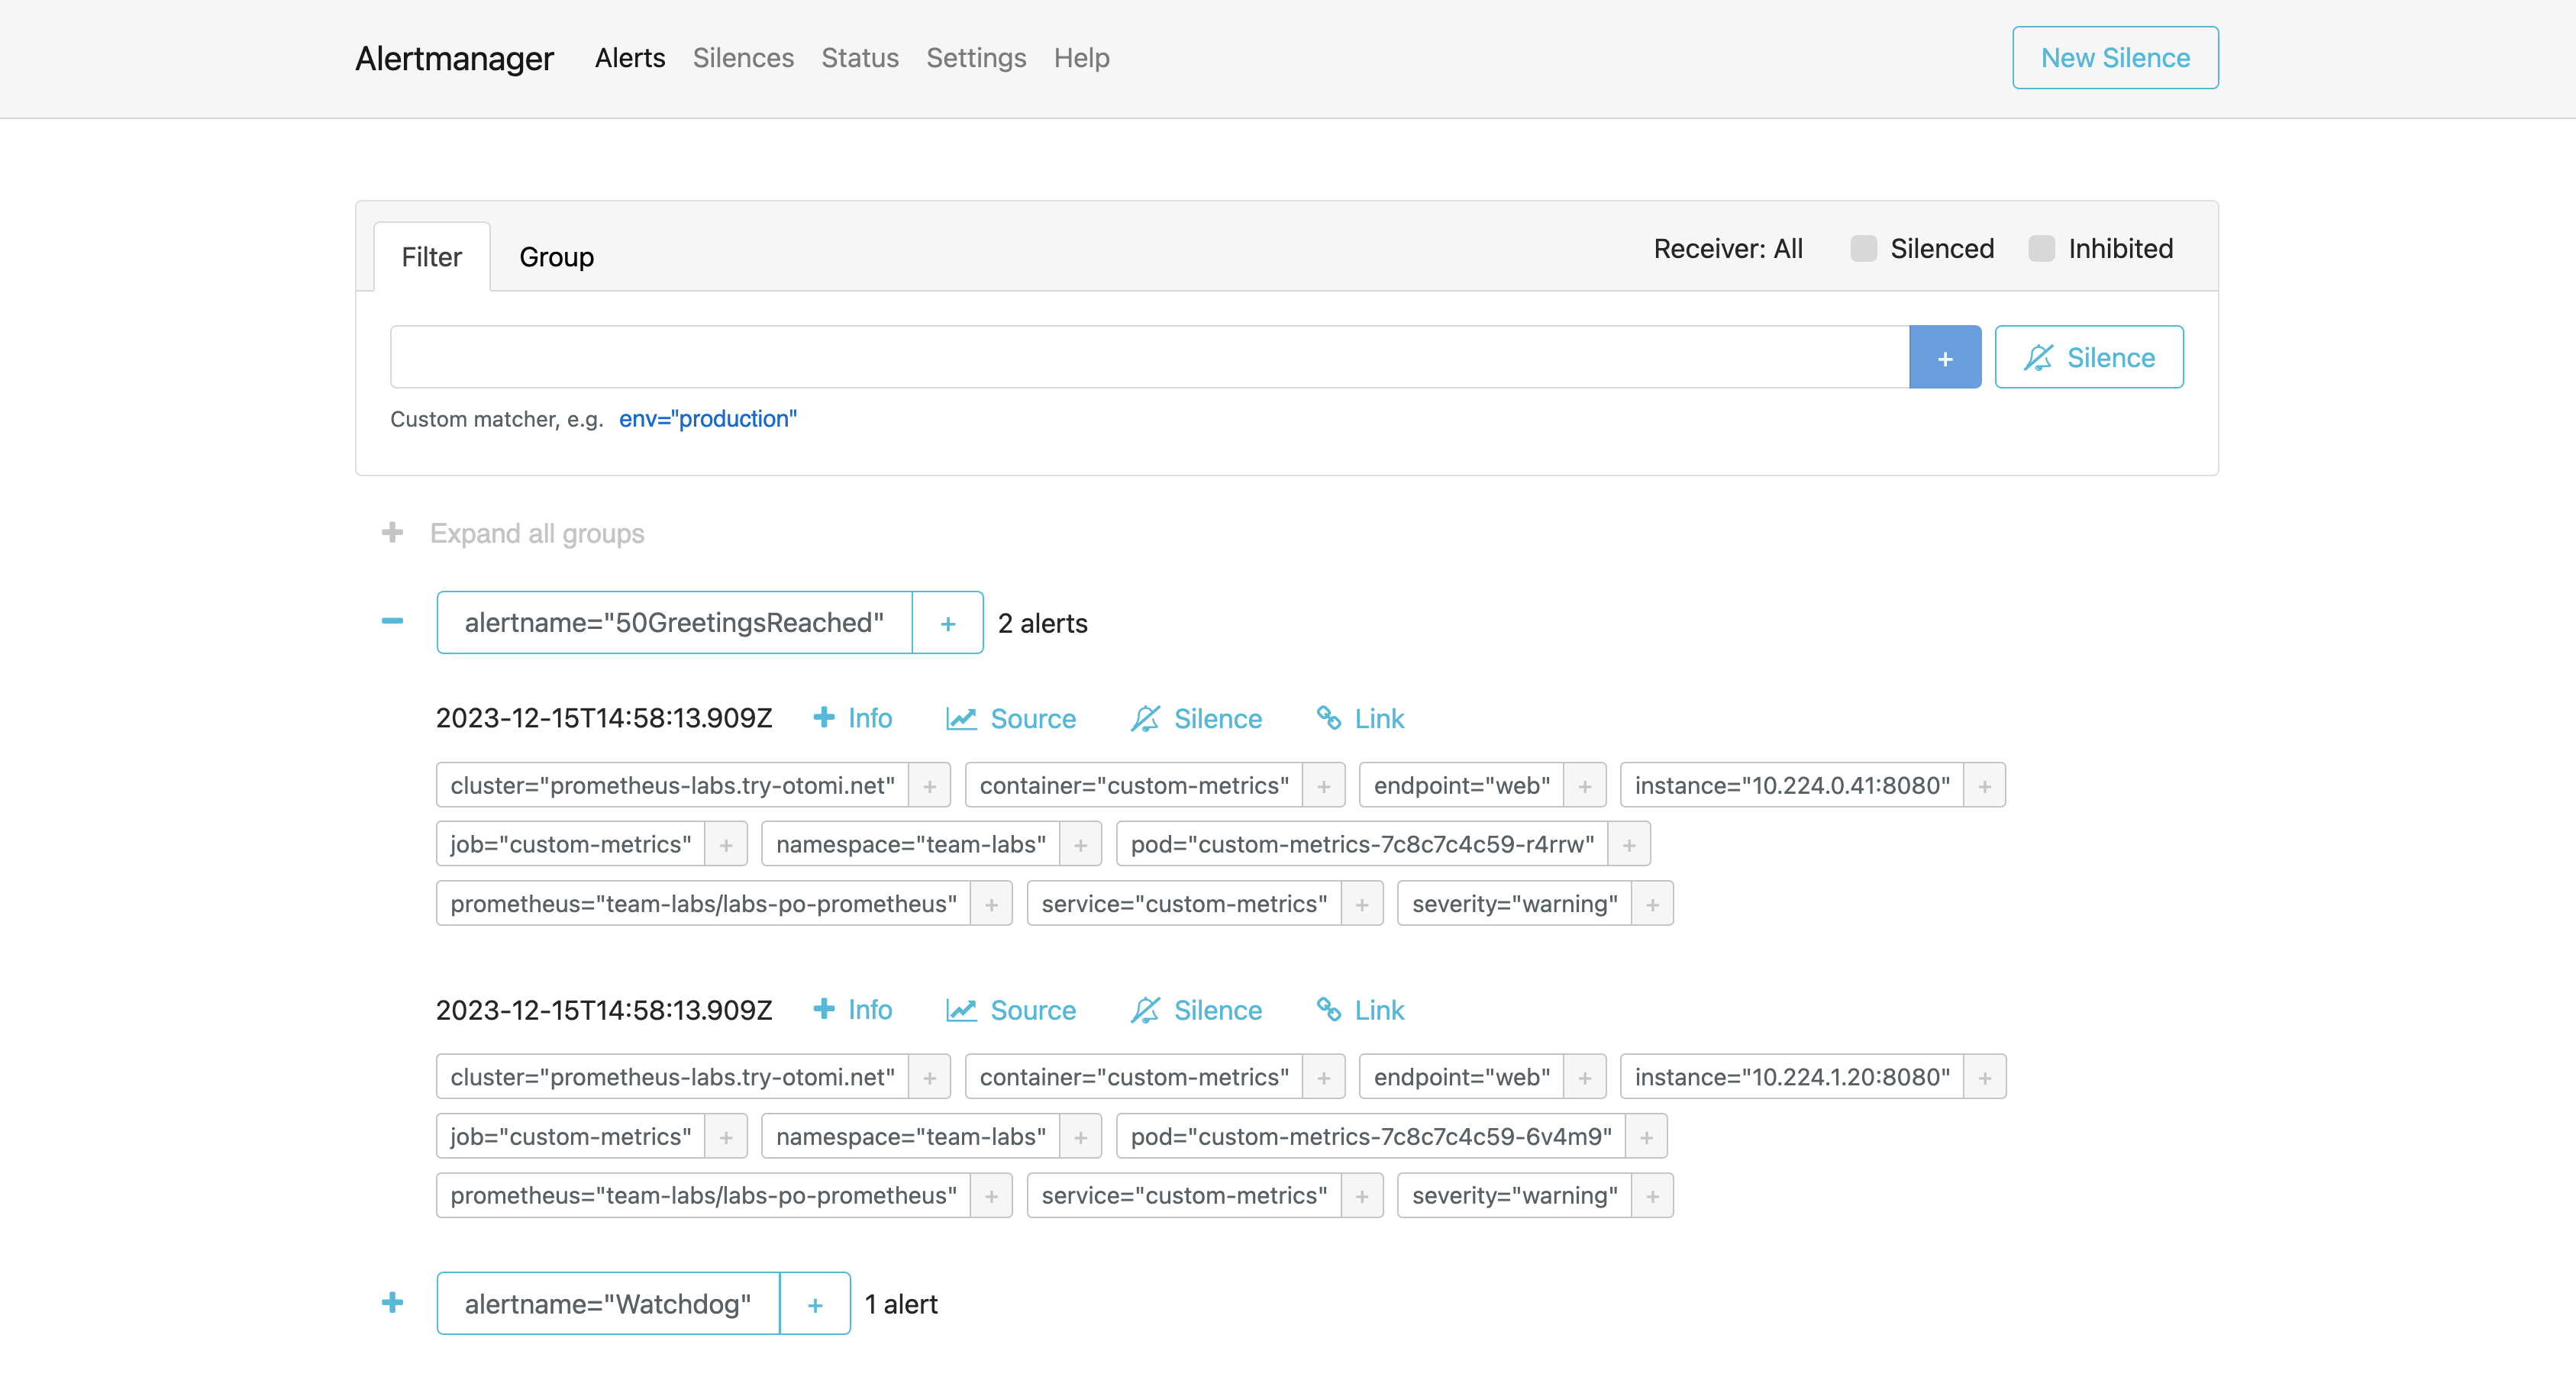
Appsand openAlertmanager -
You will see Alertmanager has received the alerts from Prometheus:

If a receiver has been configured for the Team, like Slack or email, then you would also have received a message with the alert.