View container metrics
info
Prometheus on the Platform and Dashboards for the Team need to be enabled
When your application is deployed, you would of course like to be able to see container metrics for debugging purposes. Prometheus is used for collecting metrics. When Prometheus is enabled on the platform level and Grafana is enabled for the Team, general container metrics (provided by the Platform Prometheus) can be used in Grafana dashboards.
View dashboards
- Open the Grafana app in your team apps:

- Grafana will open the Dashboards page:
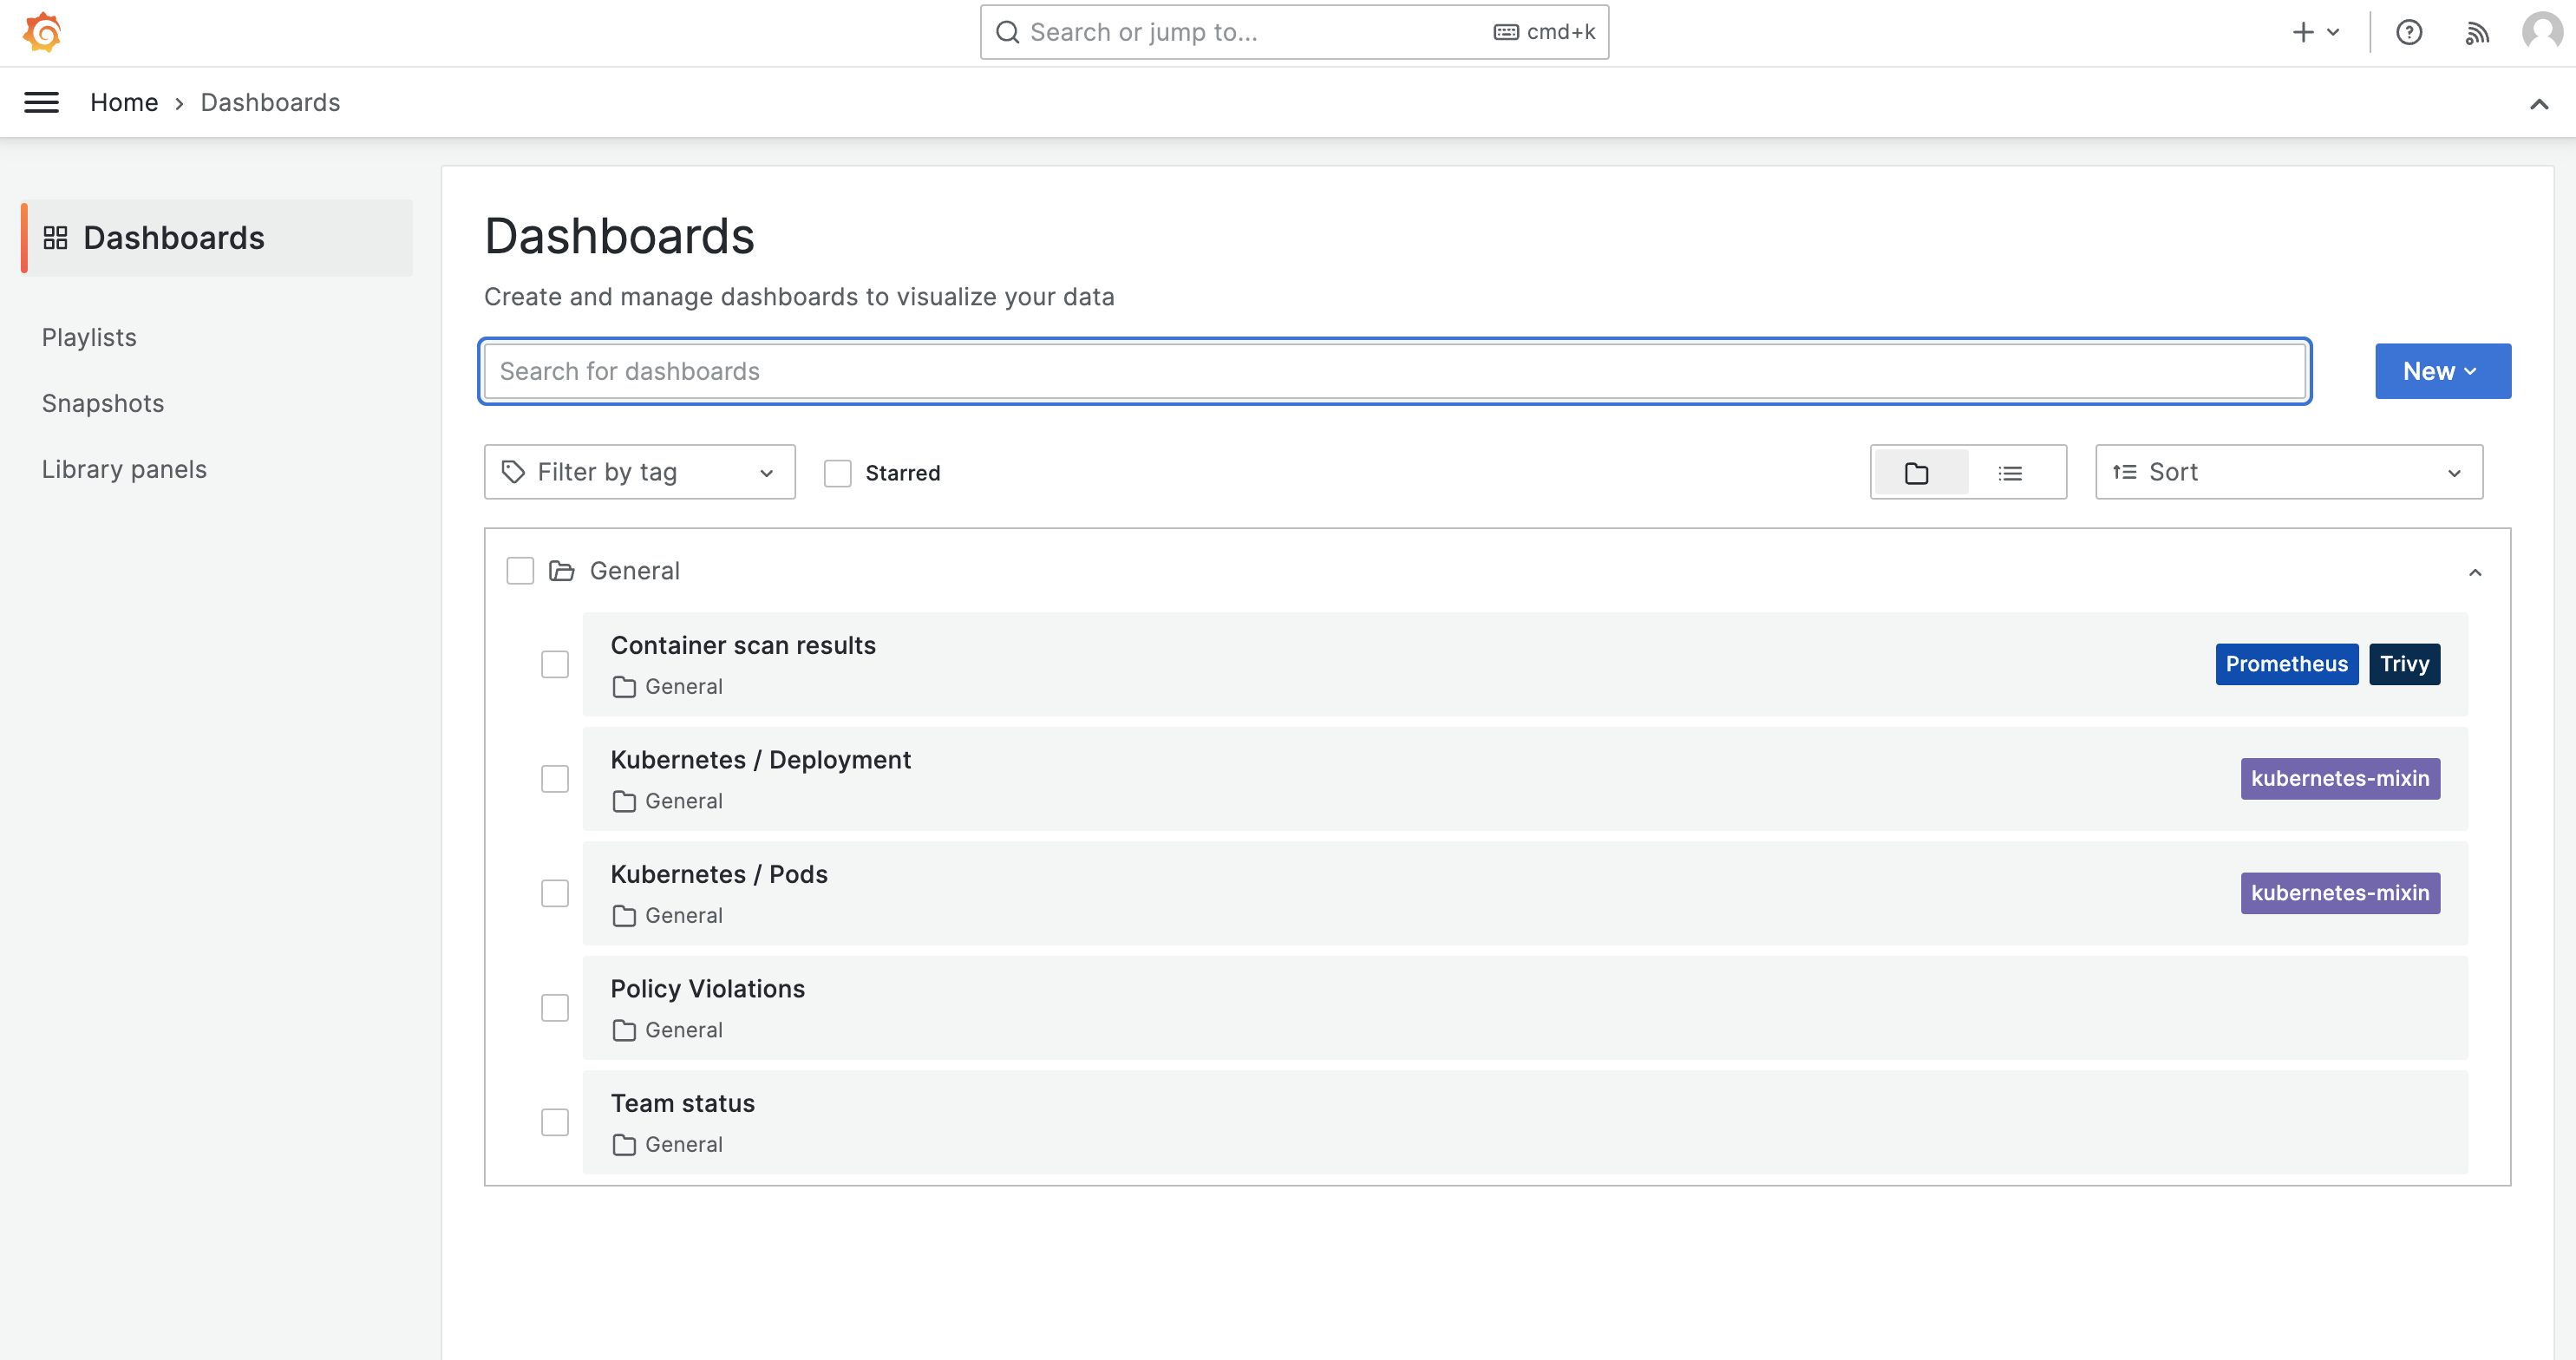
The dashboards are dynamically added based on the enabled platform capabilities:
| Dashboard | When added |
|---|---|
| Kubernetes / Deployment | When Prometheus on the platform level is enabled |
| Kubernetes / Pods | When Prometheus on the platform level is enabled |
| Team status | When Prometheus on the platform level is enabled |
| Container scan results | When Trivy Operator on the platform level is enabled |
| Detected threats in containers | When Falco on the platform level is enabled |
View container metrics
-
Click on the
Kubernetes / Podsdashboard. -
Select the desired Pod and Container, e.g.,
blue-<pod-hash>andall.